Events are small JSON documents that describe an event that happens in a system. Events come in many forms but usually they indicate things like startup, shutdown, aliveness, problems or major completed tasks. They tend to be informational and so should be considered lossy - in other words do not expect to get a shutdown event for every shutdown that happens, some kinds of shutdown can prevent it from reaching you. Likewise startups where the middleware connection is flakey.
These events come in many flavours and there are not really many standards around for this stuff, one effort cloudevents from the CNCF looks to be on a good path and once things mature we’ll look to adopt them as the underlying format for our lifecycle messages too.
In Choria we call these Lifecycle Events. I recently released an initial version 1.0.0 of the package that manages these, this post will introduce what we have today and what we use them for.
These kinds of event allow other tools to react to events happening from Choria components, some uses:
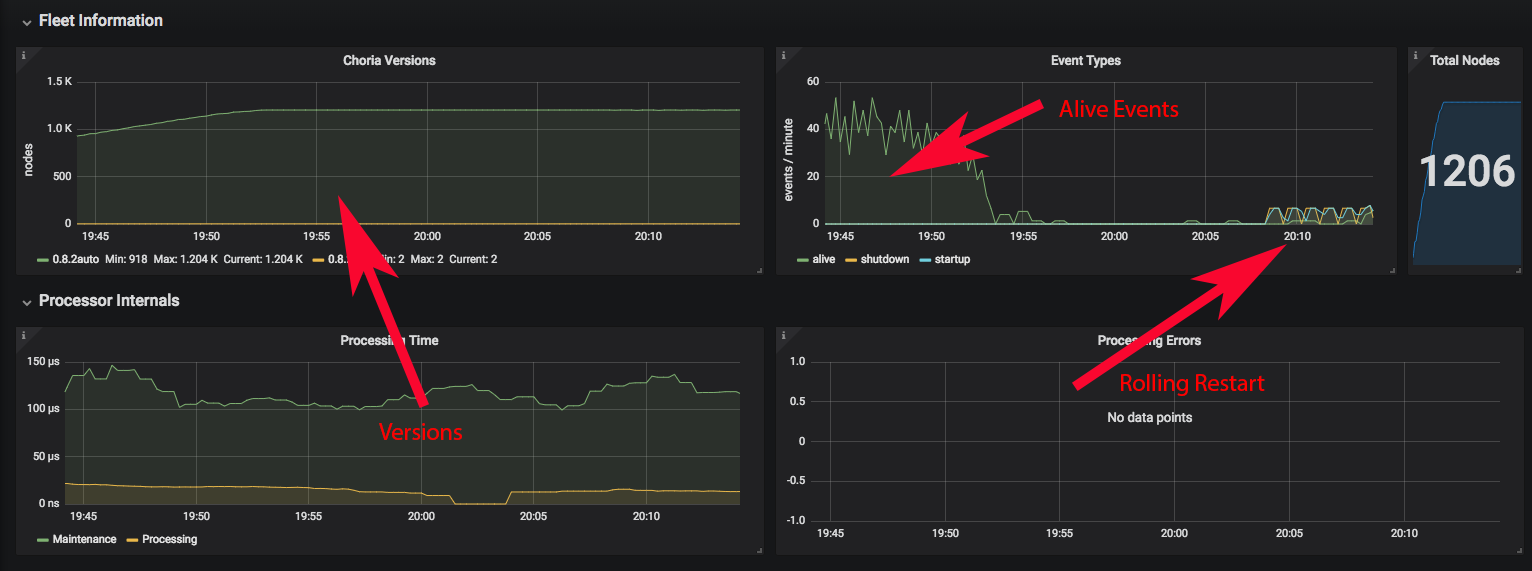
- Create a dashboard of active versions of a component by passively observing the network - use startup, shutdown and alive events.
- React to nodes starting up by activating other orchestration systems like continuous delivery systems
- React to a specific component starting up and provision them asap
There are many other cases where an event flow is useful and in time we will add richer event types.
Today Choria Server, Choria Backplane and Choria Provisioner produce events while Choria Provisioner consumes them. We are a bit conservative with when and where we emit them as the clusters we support can be in the 50k node range we need to consider each type of event and the need for it carefully.
Read on for full details.
Designing for events
A situation where we use these events is in the Choria Provisioner where we detect a new provisioning mode node starting up from its startup event of the provision_mode_server component and then trigger an immediate provision flow, the sequence diagram below indicates the flow.
provisionable
state Server->Server: Provisionable Mode Startup Server-->>Broker: Startup Event Broker-->>+Provisioner: Startup Event Note right of Provisioner: Receives event
and immediately
start provision
flow Provisioner->>Server: rpcutil.inventory Server->>Provisioner: inventory Provisioner->>Server: choria_provision.gencsr Server->>Provisioner: x509 CSR Provisioner->Provisioner: calculate configuration Provisioner->>Server: choria_provision.configure Server->>Provisioner: ack Server-->>Broker: Provisioned Event Provisioner->>Server: choria_provision.restart Server->>-Provisioner: ack Server-->>Broker: Shutdown event Server->Server: Restart to Provisioned state Server-->>Broker: Startup Event
In reality things are a bit more complex - we receive the events into a Go channel and then have a worker pool of provisioners take care of machines found through these events, the channel and pool help us control concurrency.
Using this reactive event driven approach we can provision a node including CA enrolment within a second of it starting up and it scales really well - we can configure 1000s of nodes in a minute.
Once configured other systems like our CD system pick up the startup event of configured nodes and add them to queues for delivering our software.
Observing this with the event viewer CLI shows us:
$ choria tool event
...
12:45:06 [startup] dev1.example.net: provision_mode_server version 0.99.0.20181230
12:45:06 [provisioned] dev1.example.net: provision_mode_server
12:45:06 [shutdown] dev1.example.net: provision_mode_server
12:45:07 [startup] dev1.example.net: server version 0.99.0.20181230
It’s important to note these events are informational and published on a best efforts basis, you cannot rely that you will get 100% of events, your event based systems have to consider this.
In the Choria Provisioner in addition to the above event based node discovery we also do regular discoveries for provisionable nodes which would pick up anywhere we missed their events or where their first provisioning flow failed.
At present these events are emitted within the Collective that the Servers belong to and they do not cross Federation borders and Choria cannot push them to streams via its Adapters. We’ll fix the shortcoming in Adapters that would allow you to communicate these events outside of the local Collective.
Event Types
Today we support 4 types of lifecycle event:
| Event | Description | Schema |
|---|---|---|
| Startup | Published when a process starts | v1/startup.json |
| Shutdown | Published while shutting down | v1/shutdown.json |
| Provisioned | Published when a component like a Choria Server in provisioning mode finishes it’s provisioning flow | v1/provisioned.json |
| Alive | Published hourly to indicate a component is still functioning | v1/alive.json |
Event Content, Schemas and Topics
All of the events are published in JSON format with the minimum set of fields visible below:
{
    "protocol":"io.choria.lifecycle.<version>.<type>",
    "id":"01e72410-d734-4611-9485-8c6a2dd2579b",
    "identity":"<configured identity>",
    "component":"<component>",
    "timestamp":1535369536
}
NOTE: We are migrating from a protocol format of choria:lifecycle:<version>:<type> for a while you will still see those, the Go SDK supports both.
Types would add to this for example startup and alive include a version field. Each type has a published schema, a protocol line of io.choria.lifecycle.v1.alive would be https://choria.io/schemas/choria/lifecycle/v1/alive.json
Types are any of startup, shutdown, provisioned and alive while component indicate what it is that is starting. There’s no finite list of these components but Choria Server emits server component messages.
Timestamps are UTC Unix format timestamps. The ID is a randomly generated correlation ID, usually a v4 UUID but could just be random characters in the exceptional case where UUID generation fails.
These messages are published to the Choria Broker on standard topics choria.lifecycle.event.<type>.<component>, this way you can subscribe to events matching just your interest, for example all events would be a subscription to choria.lifecycle.event.> while all alive messages would choria.lifecycle.event.alive.* or even all events types for a server would be choria.lifecycle.event.*.server.
Viewing events
If you just want to observe your network from the CLI we have 2 ways to do it, if you have choria you can do choria tool event --component server --type alive to show server alive messages, without any --component or --type you will see all events.
$ choria tool event
Waiting for events from topic choria.lifecycle.event.> on nats://broker1.example.net:4222
12:45:03 [shutdown] dev1.example.net: server
12:45:06 [startup] dev1.example.net: server version 0.99.0.20181230
It supports –debug to see the raw events:
$ choria tool event --debug
DEBU[0000] Logging at debug level due to CLI override
Waiting for events from topic choria.lifecycle.event.> on nats://broker1.example.net:4222
{"protocol":"choria:lifecycle:shutdown:1","identity":"dev1.example.net","component":"server","timestamp":1546257693}
{"protocol":"choria:lifecycle:startup:1","identity":"dev1.example.net","component":"server","timestamp":1546257701,"version":"0.99.0.20181230"}
In Choria these events are produced by the go-lifecycle project, it includes a viewer:
$ lifecycle view
Which works just like the choria one above and also supports filtering what you see.
Creating event dashboards
Included in the go-lifecycle projects lifecycle binary is a feature that can be used to passively observe a running Choria network and record all the components and versions of a specific type, the information is presented to Prometheus for consumption:
lifecycle tally --component server --port 8080
This will observe the server component and produce these stats:
| Metric | Description |
|---|---|
| lifecycle_tally_good_events | Events processed successfully |
| lifecycle_tally_process_errors | The number of events received that failed to process |
| lifecycle_tally_event_types | The number of events received by type |
| lifecycle_tally_versions | Gauge indicating the number of running components by version |
| lifecycle_tally_maintenance_time | Time spent doing regular maintenance on the stored data |
| lifecycle_tally_processing_time | Time spent processing events |
Configure Prometheus to poll /metrics.
The kind of dashboard you can create with these events can be seen below, we’ll add it to the repo soon.
Producing events
We have an SDK for producing events from Choria Golang components - but really these are just JSON published via the NATS protocol that the Choria Broker supports so you can emit these from more or less anything.
Publishing from Go
The event API does not try to connect to the middleware for you, it’s assumed you have this already - the Choria Framework package can do this (see the example later) - so it accepts a Choria connector and will publish over that.
event, err := lifecycle.New(lifecycle.Startup, lifecycle.Identity("my.identity"), lifecycle.Component("my_app"), lifecycle.Version("0.0.1"))
panicIfErr(err)

// conn is a Choria connector, see the consuming examples for a much
// more detailed code section that includes initializing that
err = lifecycle.PublishEvent(event, conn)
panicIfErr(err)
Each event type might require unique set of options to be passed, refer to the API documentation for what each take.
Publishing from a Go Agent
If you have an agent that you compile into the Server and perhaps you want to publish an event from an action you can do it like below, we use this from the Provisioning Agent to indicate when a server is ready to be used.
func configureAction(ctx context.Context, req *mcorpc.Request, reply *mcorpc.Reply, agent *mcorpc.Agent, conn choria.ConnectorInfo) {
    err = agent.ServerInfoSource.NewEvent(lifecycle.Provisioned)
    if err != nil {
        agent.Log.Errorf("Could not publish provisioned event: %s", err)
    }
}
If you need to pass any options to the event factory you can do so in the call to NewEvent(), it will set Identity, Version and Component for you, if you supply those yours will override the ones the server sets.
Consuming events
Again I’ll show the Go SDK way to consume these however realise that the Choria Broker speaks the NATS protocol and so any NATS client can connect, subscribe and consume these events. Previously we detailed the generated topics that these are published to.
First for completeness I’ll show how to set up a basic Choria framework and hook into the events, here it will use the normal Choria client configs to find middleware, certificates and more.
Basic program setup including Choria initialization (click to expand)
import (
    "github.com/choria-io/go-choria/choria"
    "github.com/choria-io/go-choria/config"
    lifecycle "github.com/choria-io/go-lifecycle"
)

var log *logrus.Entry

func setupChoria(ctx context.Context) (*choria.Framework, choria.Connector, error) {
    fw, err = choria.New()
    if err != nil {
        return nil, nil, err
    }

    log = fw.Logger("events")

    conn, err := fw.NewConnector(ctx, fw.MiddlewareServers, fw.Certname(), log)
    if err != nil {
        return nil, nil, err
    }

    return fw, conn, nil
}

func main() {
    ctx, cancel = context.WithCancel(context.Background())
    defer cancel()

    fw, conn, err := setupChoria(ctx)
    panicIfErr(err)

    events := make(chan *choria.ConnectorMessage, 100)

    subid, err := uuid.NewV4()
    panicIfErr(err)

    err = r.options.Connector.QueueSubscribe(ctx, subid.String(), "choria.lifecycle.event.>", "", events)
    panicIfErr(err)

    for {
        select {
        case e := <-events:
            // this event is a lifecycle.Event that is in effect perhaps a
            // lifecycle.AliveEvent, later we will coerce it to the right type
            event, err := lifecycle.NewFromJSON(e.Data)
            if err != nil {
                log.Errorf("could not parse event: %s", err)
                continue
            }

            err = process(e)
            if err != nil {
                log.Errorf("could not process event: %s", err)
                continue
            }

        case <-ctx.Done():
            conn.Close()
            return
        }
    }
}
Above you can see turning the JSON data into an event is quite easy - lets say you manage your own connection to the NATS middleware this is really all you need to care for:
event, err := lifecycle.NewFromJSON(ebytes)
if err != nil {
    log.Errorf("could not parse event: %s", err)
    continue
}

err = process(e)
if err != nil {
    log.Errorf("could not process event: %s", err)
    continue
}
So that connects us up and delivers lifecycle.Event instances to a process(e lifecycle.Event) error function, lets look at that function:
func process(e lifecycle.Event) error {
    // we need to understand what kind of message it is so we can coerce it to the right type
    switch e.Type() {
        case lifecycle.Alive:
            // we know what it is so we can safely coerce it to the right type, but for completeness
            // I show how to validate it and not panic
            alive, ok := e.(*lifecycle.AliveEvent)
            if !ok {
                return fmt.Errorf("Failed to process event from %s as an Alive event", e.Identity())
            }

            // and now we can access the type specific field like Version
            log.Infof("Handling alive event from %s with version %s", alive.Identity(), alive.Version)

        case lifecycle.Shutdown:
            shutdown := e.(*lifecycle.ShutdownEvent)
            // these have no version
            log.Infof("Handling shutdown event from %s", startup.Identity())

        default:
            log.Errorf("Unsupported event type %s received from %s", e.TypeString(), e.Identity())
    }
}
Conclusion
These events are really helpful in building reactive infrastructure and passively observing a fleet of nodes, we’ll continue to add event types as we see a need and iterate on the ideas.