Overview
We’re happy to announce a new project called Choria Scout - a highly scalable system health monitoring framework and monitoring data pipeline released under the Apache 2.0 license.
Initially we support the ability to execute Nagios compatible plugins on Choria managed nodes with results sent centrally in a standard CloudEvents format, and optionally, integrated into Prometheus.
These are framework level building blocks that will in time be used to create a full monitoring stack built on Choria technologies. Checks and value overrides can already be configured using our Puppet modules. You can also use these building blocks to build entirely custom solutions for your own needs.
Scout will be a cloud native project with central components capable of being hosted on Kubernetes and using data formats supported by commercial clouds and projects like KNative. It will have a focus on integration, open data exchange and extensibility.
Despite being cloud native we will of course support monitoring anything where Choria, or the upcoming Scout agent, can run which includes traditional baremetal, VMs, containers and pods and small devices.
Background
I recently had to refresh my infrastructure and revisited how many things are done - I now host all the Choria components on Kubernetes using our WIP helm repos and as a result also had to revisit monitoring for those components. Additionally, I have a number of traditional hosts for nameservers, development environments and more.
For the traditional hosts I did not find any appealing free solution released under a true Open Source basis and realised I had almost 100% of what I need to build a compelling monitoring platform, and it will tie in nicely with the recent work I did to make Goss usable as a Go Package.
Features
As Choria is very framework focused - and really an operations integration platform at heart - I am not trying to solve all the problems myself but focusing on maximising the integration possibilities: we’ll supply a batteries included system, but it will be highly interoperable with Cloud Native technologies.
So, first of all, here are a few screenshots of Dashboards and such, then I’ll break down the features.
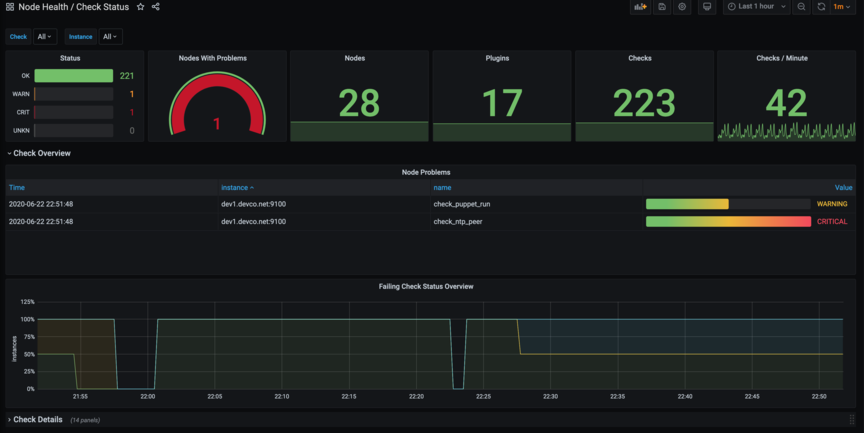
This dashboard shows overall views of checks, problems and have an additional expanded view showing selected checks and issues found.
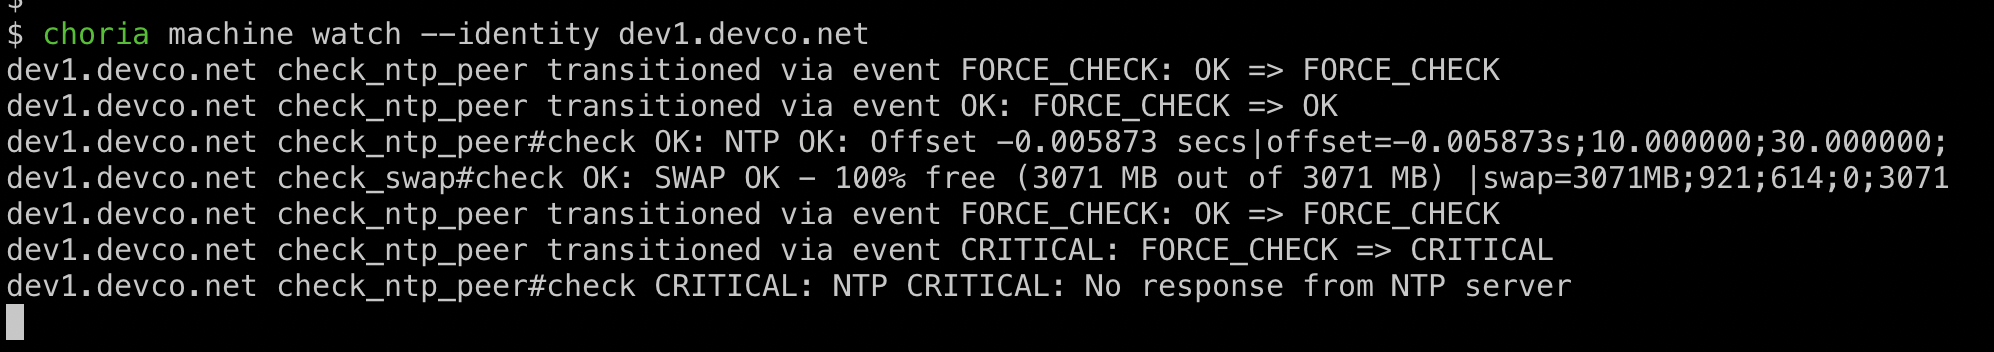
This is a live view of the Cloud Events being emitted by the system.
choria::scout_check{"check_typhon":
    plugin            => "/usr/lib64/nagios/plugins/check_procs",
    arguments         => '-C typhon -c {{ o "warn" 1 }}:{{ o "crit" 1 }}',
    remediate_command => "service typhon restart",
}
The block above creates a check which includes auto-remediation and node specific overrides via JSON data on the node.
Current main features:
- Once configured, checks run without any central coordination and without requiring network connections
- Supports the popular Nagios 4 exit code plugin API with Goss support planned
- Support auto-remediation of issues without any central coordination
- Scalable to hundreds of thousands of nodes
- Event archival and Stream Processing via NATS JetStream
- CLI observation tools to view a stream of live results and force or inhibit checks
- API to set maintenance mode for any check or force immediate checks, subject to AAA, 2FA and OPA Policies with support for authentication against Okta and other enterprise systems. Ruby and Golang supported.
- Can integrate with any other Autonomous Agent features such as cron-like 5-field schedules for when checks should run
- Alerting through the Prometheus Alertmanager with integrations to Pager Duty etc
- Check results can optionally be published to Prometheus Node Exporter to enable Prometheus + Grafana for over all health, aggregate statuses and node-level dashboards showing all checks and alerts for a node.
- For non-Prometheus integrations, each state transition gets published as a CloudEvents v1.0 format message
- Each check result (or just problem ones) are published as CloudEvents v1.0 format messages
- Optional configuration via Puppet
Future features:
- AAdditional related Autonomous Agent Watchers such as integration into Goss
- Check Configuration updated without Puppet utilising NATS JetStream
- Purpose built CLI manager
- A Gateway suite to filter, modify and emit events into other systems
- A purpose specific distribution of the features into a purpose built binary
- Single binary install
- Auto-enrolling of new nodes into the infrastructure including Certificate Authorities managed by Kubernetes cert-manager
- Suitable for deploying as side cars next to microservices in Kubernetes
- Included event router to send Cloud Events to KNative, Azure Event Grid and similar systems
Conclusion
This is the first in a series of posts about this feature. The core work to add Nagios check support to the Autonomous Agents took about 4 hours and all the rest of the features are essentially things Choria already had and that just happened by default.
Follow up posts will look at aspects of the system in detail and explore how this was built.