Prometheus
Scout can integrate with Prometheus Node Exporter, review the Configuration section for guidance on configuring the Scout integration.
Alerts
If you use the Prometheus Alert Manager you can define alerts as below, of course you will need to tweak to your specific environment but this might be a good starting point.
- alert: HeartbeatCritical
  expr: choria_machine_nagios_watcher_last_run_seconds{name="heartbeat"} < time() - 150
  for: 10m
  labels:
    severity: critical
  annotations:
    summary: "{{ $labels.name }} checks are not active on {{ $labels.instance }}"
    description: "Node {{ $labels.instance }} {{ $labels.name }}"
    value: WARNING

- alert: CheckUnknown
  expr: choria_machine_nagios_watcher_status==3
  for: 10m
  labels:
    severity: warning
  annotations:
    summary: "{{ $labels.name }} in WARNING state on {{ $labels.instance }}"
    description: "Node {{ $labels.instance }} {{ $labels.name }}"
    value: WARNING

- alert: CheckCritical
  expr: choria_machine_nagios_watcher_status==2
  for: 10m
  labels:
    severity: critical
  annotations:
    summary: "{{ $labels.name }} in CRITICAL state on {{ $labels.instance }}"
    description: "Node {{ $labels.instance }} {{ $labels.name }}"
    value: CRITICAL

- alert: CheckWarning
  expr: choria_machine_nagios_watcher_status==1
  for: 15m
  labels:
    severity: warning
  annotations:
    summary: "{{ $labels.name }} in WARNING state on {{ $labels.instance }}"
    description: "Node $labels.instance $labels.name"
    value: WARNING
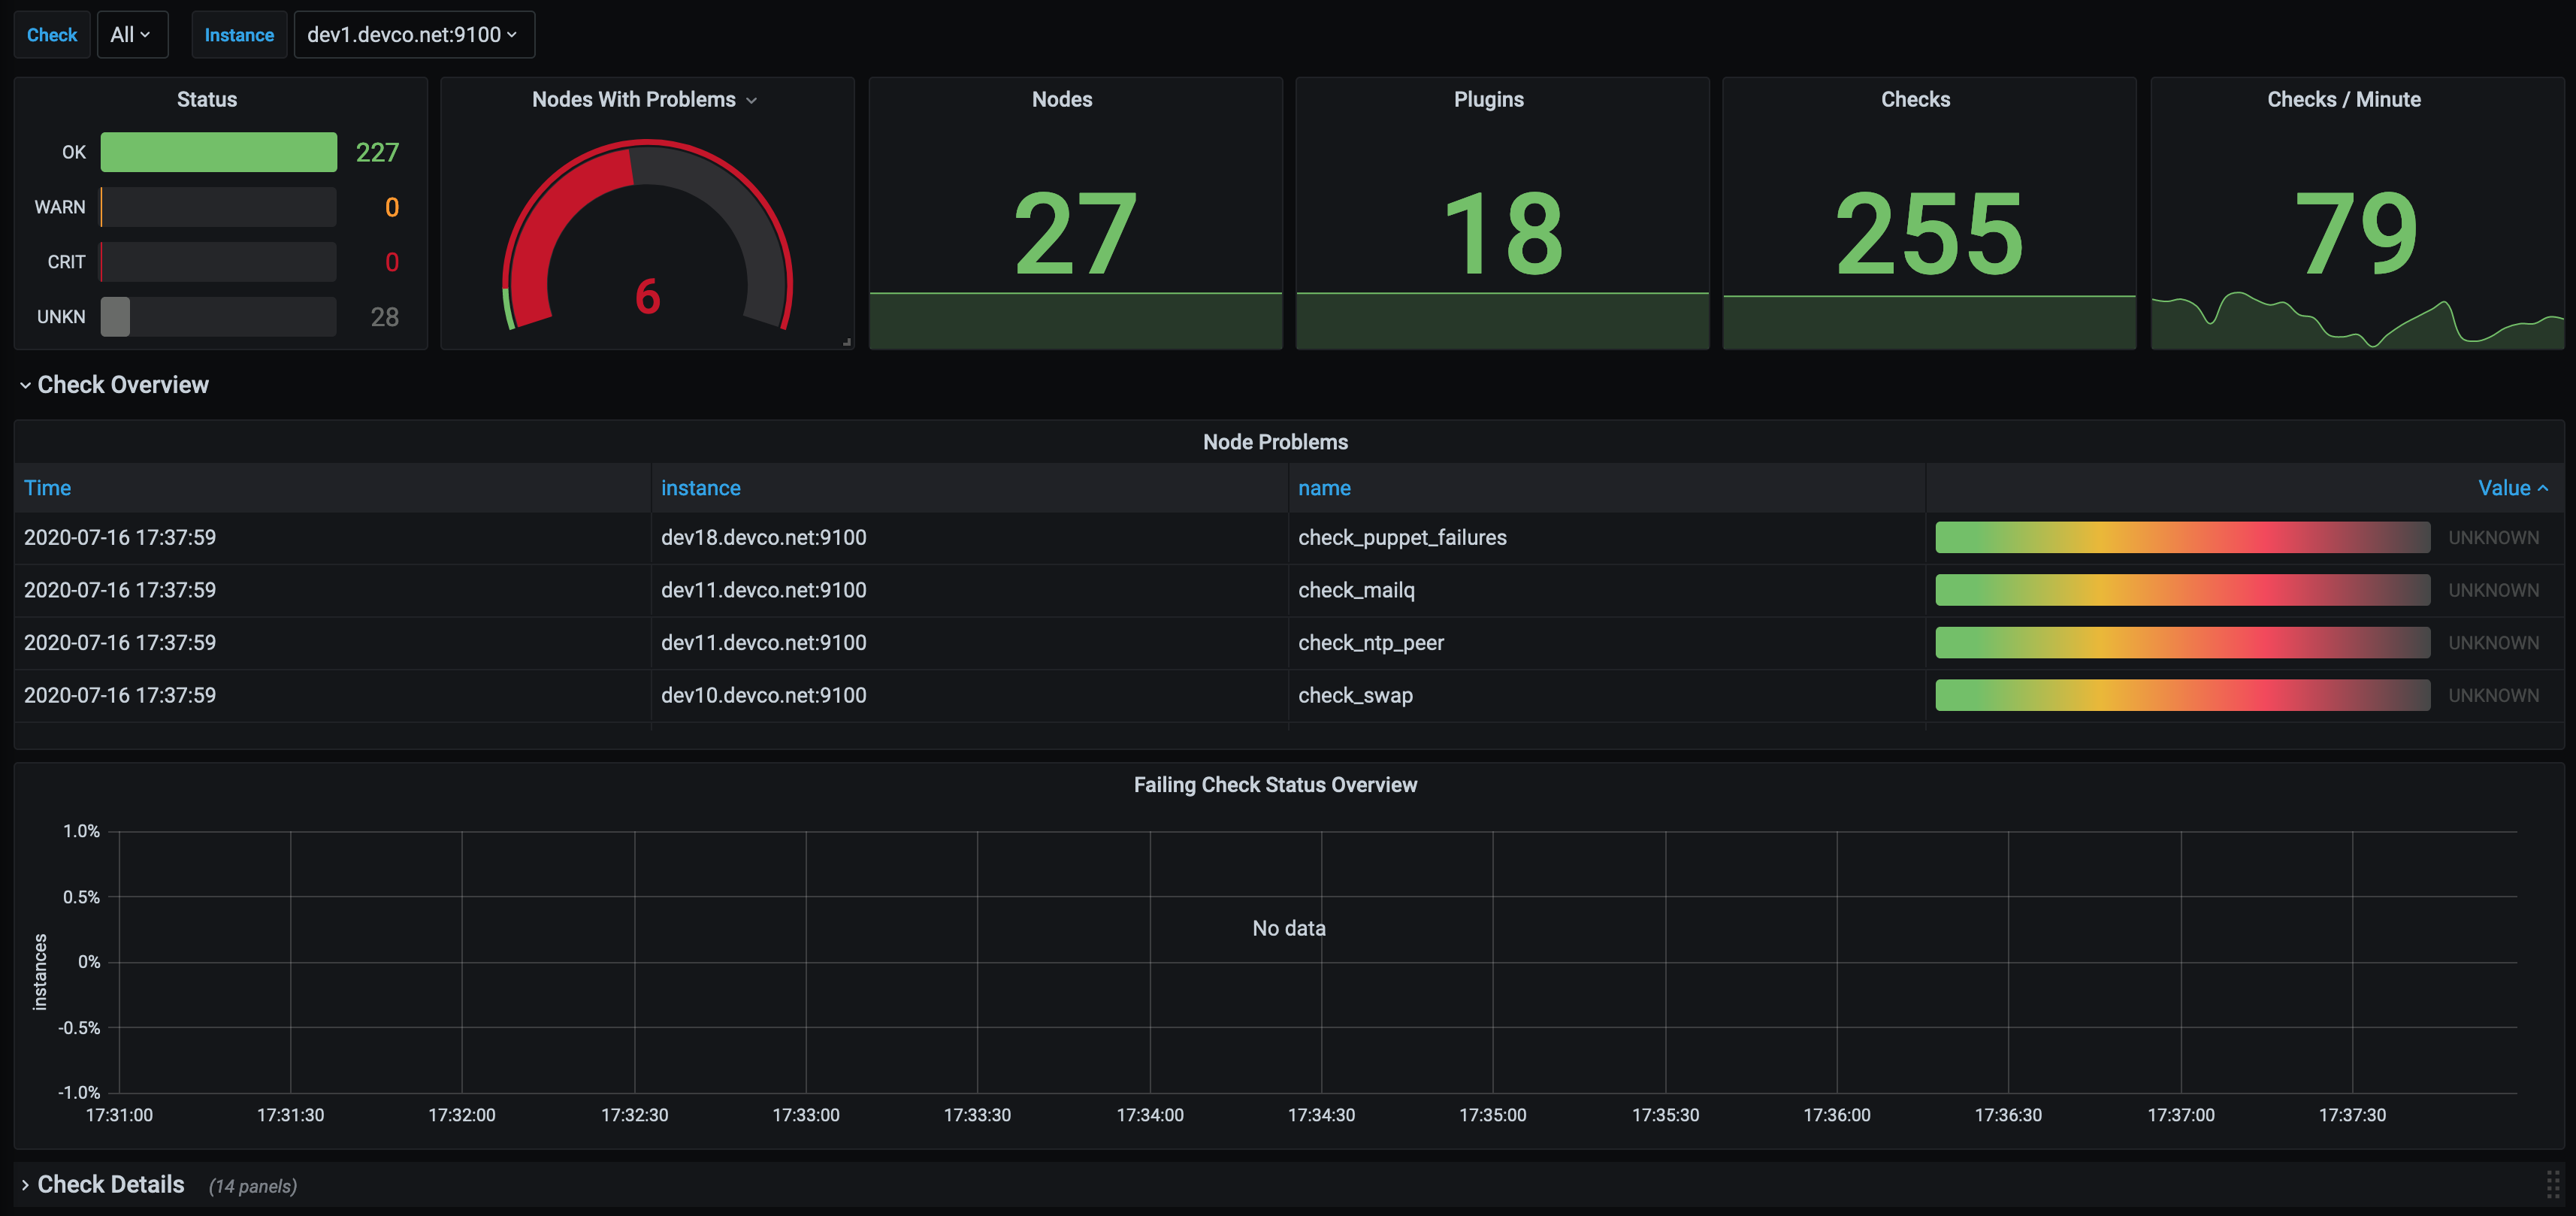
Dashboards
A basic dashboard is available on the Grafana Plugins Repository.
Data
Here is a sample of the data that will be published to Prometheus:
# HELP choria_machine_nagios_start_time Time the Choria Machine subsystem started in unix seconds
# TYPE choria_machine_nagios_start_time gauge
choria_machine_nagios_start_time 1594911782
# HELP choria_machine_nagios_watcher_status Choria Nagios Check Status
# TYPE choria_machine_nagios_watcher_status gauge
choria_machine_nagios_watcher_status{name="check_mailq",status="OK"} 0
# HELP choria_machine_nagios_watcher_last_run_seconds Choria Nagios Check Time
# TYPE choria_machine_nagios_watcher_last_run_seconds gauge
choria_machine_nagios_watcher_last_run_seconds{name="check_mailq"} 1594915444
# HELP choria_machine_nagios_watcher_checks_count Choria Nagios Check Count
# TYPE choria_machine_nagios_watcher_checks_count counter
choria_machine_nagios_watcher_checks_count{name="check_mailq"} 14