Large Scale Design
This is a reference design for a very large scale Choria deployment. This deployment supports a job orchestration system that allows long-running, multi-site/multi-region workflows to be scheduled centrally while allowing region level isolation. It supports multiple access models and forms the basis for a robust Enterprise scale automation platform allowing expansion in many directions.
This is not a typical deployment that one would build using Puppet and most users do not need to think in these terms, but it does demonstrate the potential of the framework and how some of these concepts can be combined into truly large-scale orchestration platform.
This architecture has been deployed successfully across global organisations with 100s of Data Centers / Regions, 100s of thousands or even millions of fleet nodes, both on-prem and cloud based.
Goals
The goal of this architecture is to provide a connective substrate that enables a very large enterprise workflow system to be built. Such large workflow system makes many demands of the underlying infrastructure and need to be able to run over heterogeneous infrastructure.
We’ll discuss this architecture in the context of a system that can execute workflows as simple as executing a single command on 10s of thousands of nodes in a region or as complex as a multi-stage workflow that can run for a long time, orchestration 100s or 1000s of steps. Single workflows can impact machines in multiple regions, have sub-workflows and have dependencies on completion of steps that happen in other regions. Everything built on a foundational mature security model providing strong Authentication, Authorization and Auditing.
In this document we will not dwell much on the actual workflow engine rather we show how the various components of Choria would enable such a system to be built reliably and at large scale. A conceptual design of the actual workflow system might be included later, but the actual flow engine is not a component included in Choria today. One can mentally replace this workflow component with any other component that need access to programmable infrastructure.
The kinds of workflows discussed are for tasks like data gathering, remediation, driving patch exercises or providing intel during outages, additionally, regular observation of fleet state via Choria Scout can feed into ML models enabling work in the AI Ops space.
It’s been shown that in large enterprises this system can support millions of workflow executions on a daily basis once integrated into enterprise monitoring and other such systems.
A number of systems are required to realise such a system, a few are listed here and this document will explore how these are built using Choria technologies:
- Ability to deliver the agent with low-touch overhead, self-managing its lifecycle, configuration, availability and security.
- Should present a single unified interface to different generations of platform from artisanal baremetal to highly ephemeral cloud infrastructure and everything in between
- Integration into existing Enterprise security be it Certificate Authorities, SSO or 2FA tokens from different vendors and with different standards.
- Node introspection to discover its environment, this includes delivery of metadata gathering plugins at a large scale.
- Fleet metadata collected and stored for every node, regionally and globally, continuously.
- Telemetry of node availability.
- Fast and scalable RPC subsystem to invoke actions on fleet nodes using mature backend programming languages. The RPC system should provide primitives like canaries, batching, best-effort or reliable mode communication and more.
- Various components on fleet nodes can communicate their state, job progress and other information into the substrate without having to each manage reliable connections which would overwhelm the central components with short-lived connections.
- Open data formats used to maximise integration in a highly heterogeneous environment, maximising return on investment.
- Efficient processing of fleet state data using Enterprise programming languages using familiar streaming data concepts.
- Isolated cellular design where individual cells (around 20 000 fleet nodes per cell) can function independently.
Overview
As mentioned the system will be cellular in design - in Choria we call each cell and Overlay. Each Overlay has a number of components:
- Choria Network Brokers with the Choria Streams capability enabled
- Choria Provisioner that provisions individual fleet nodes onto the Choria network
- Choria AAA Server providing integration with Enterprise SSO systems, pkcs11 tokens and more
- Choria Stream Replicator allowing data from an overlay to be replicated to a region or to a central location
Generally, depending on the availability model chosen for the Network Brokers, this is around 3 to 5 nodes required to manage each Overlay.
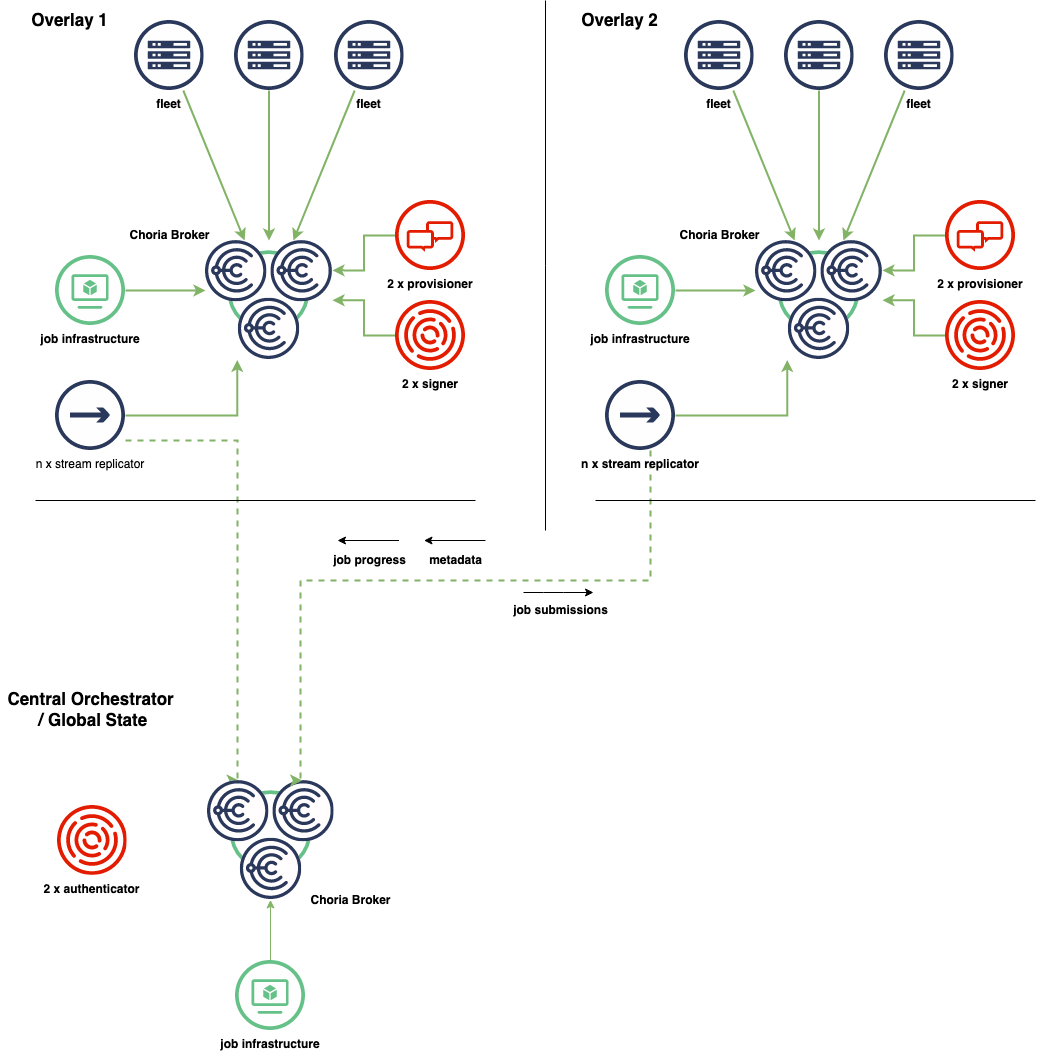
Here we see the various components within each Overlay networks shown, highlighting the full independence of each Overlay. Each Overlay is identical.
The Stream Replicator component is used to move data between environments in an eventually consistent manner, that is, should Overlay 1 be isolated from the network as a whole the job infrastructure can submit jobs locally. Job statuses, job progress records and metadata gathered during the time and so forth are all kept in the Overlay until such time as the connectivity to the rest of the world is restored. At that time the Stream replication will copy the data centrally.
This builds an environment where, even when isolated, an Overlay can manage itself, auto remediate itself, affect change based on input from external systems etc. Any actions taken while isolated will later flow to the central location for auditing and tracking purposes.
Essentially the workflow system becomes a system of many cooperating workflow systems with each Overlay being fully capable but that can cooperate to form a very large global system.
Node Provisioning
In a typical Choria environment Puppet is used to provision a uniform Choria infrastructure integrated into the Puppet CA. This does not really work in large enterprises as the environments tend to be in all shapes, sizes and generations. There might be Baremetal managed using ancient automation scripts, VMWare systems, OpenStack systems, Kubernetes based container infrastructure and everything in between running in different environments from physical data centers to cloud to PaaS platforms.
Choria therefore supports a provisioning mode where the process of enrolling a node can be managed on a per-environment basis, this is where we manage the vast differences in environments, platforms, etc. Once Choria is installed we have a unified overlay interface:
- Custom endpoints for provisioning where needed. Optionally programmatically determined via plugins that can be compiled into Choria
- Fully dynamic generation of configuration based on node metadata and fleet environment
- Self-healing via cycling back into provisioning on critical error
- On-boarding of machines at a rate of thousands a minute
The component that owns this process is the Choria Provisioner and within Choria Server a special mode can be enabled by using JWT tokens or plugin.
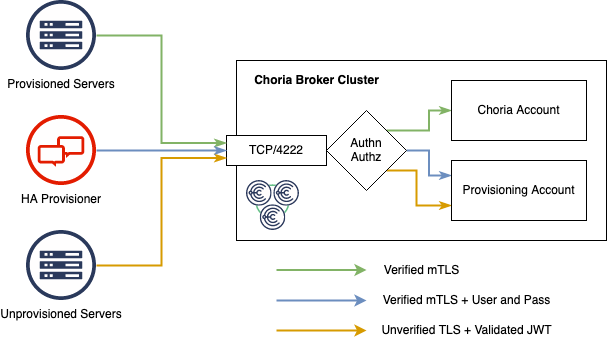
The Choria Broker has a special mode that enables unprovisioned fleet nodes to connect using unverified TLS connections. At first this seems risky to allow unverified and verified TLS connections, however we have several mitigations to make this safe:
- Unverified TLS support is off by default
- Connections coming in on unverified connections MUST present a JWT that MUST validate using the public certificate the broker has in its configuration
- Connections presenting a
ProvisioningPurposetoken is allowed to connect, those servers have very strict permissions. They cannot communicate with any other unprovisioned servers and may only start a specific few agents - The Choria Provisioner MUST connect over verified TLS and must present a password matching one the broker has in its configuration. Only the Choria Provisioner can make requests to unprovisioned nodes.
- The entire provisioning system is isolated within the broker in an Account - meaning there is no Choria communications between provisioned and unprovisioned nodes
- Life-cycle events are transported into the Choria account and into Streams to facilitate a central audit stream
This means the central - redundant - broker infrastructure can be used to accept unprovisioned nodes, it also means the Choria Provisioner can use Choria Streams for leader election and have it be hosted on a reliable cluster without dedicating resources to provisioning.
The general provisioning flow is as follows:
- Choria Server starts up without a configuration
- It checks if there is a provisioning.jwt in a well known location (see
choria buildinfo) or interrogate a site specific plugin - The token is parsed and configuration like SRV domain, locations of metadata to expose and more is read from it.
- Choria Server activates the choria_provisioning agent that is compiled into it, this agent is usually disabled in Puppet environments.
- Choria Server connects to the infrastructure described in the token and wait there for provisioning. Regularly publishing CloudEvents and, optionally node metadata.
- It checks if there is a provisioning.jwt in a well known location (see
Here the provisioning.jwt is a token that you would generate on a per Overlay or Region basis and it would hold provisioning configuration for that region.
The Choria Provisioner actively listens for CloudEvents indicating a new machine just arrived in the environment ready for provisioning. Assuming sometimes these events can be missed it also actively scans, via the discovery framework, the network for nodes ready for provisioning.

We show an external helper, this is just a script or command that reads data on it’s STDIN and writes the result to STDOUT. Any programming language can be used. Using this one can provide a single provisioner for an entire region or even globally, the provisioner can decide what Overlay to place a node in.
This is an important capability, being able to intelligently place nodes in the correct Overlay means all nodes that form part of the same customer service in a region can be in the same Overlay meaning in an isolation scenario all infrastructure for a client can still be managed. One can also imagine that having a shared databased in use by 10s of customers it would be beneficial to place the database, and those customers in the same Overlay.
The decision about which Overlay to place a node can be made by metadata provided by the node and by querying Overlay level metadata storage to find the associations. One can also use this to balance, retire or expand the Overlays in a region by for example re-provisioning all nodes in a specific Overlay and then spreading those nodes around the remaining Overlays.
Being that the extension point is an external script any level of integration can be done that a user might want without recompiling any Choria components.
Generally the flow is based on a ED25519 key exchange where the server generates a Private Key and signs a Nonce the Provisioner gave it. The Public key having been verified is then placed in a ServerPurpose JWT token along with claims giving servers access to certain features, organizational units and more.
Further Reading
- Mass Provisioning Choria Servers
- Upcoming Server Provisioning Changes
- Provisioning HA and Security
- Provisioning Agent Repository
TODO
- Reprovision on Token expiry go-choria#1309
Enterprise Authentication
In cases where user level access to Choria will be provided it might be desirable to provide a flow where users need to login to the Choria environment using something like choria login, this might require 2FA token, enterprise SSO or other integrations.
Choria supports these using a flow supported by the Choria AAA Service.
Authentication
The AAA Service is split into 2 parts. First you need an Authenticator service that handles the login flow, almost by it’s very nature this will vary from Enterprise to Enterprise. Out of the box we support a static user list file and we can integrate with Okta Identity Cloud. This is not going to be enough for real world large scale use.
The purpose of the Authentication step is two-fold; first it establishes who you are by means of username and password, 2FA token or any other means and secondly it encodes what you are allowed to do into a JWT token.
In the case of our workflow system, authorization happens against the user database and IAM policies embedded into the workflow engine. Typically there would be entitlements assigned by or approved by ones manager and based on these entitlements certain access is allowed.
The authentication system is therefor typically rolled out centrally on highly reliable infrastructure. This can be augmented with in-region or in-overlay authentication services that can be used when the Overlay is isolated, or even augmented with a more traditional certificate-only approach. These 2 models can co-exist on the same Choria deployment.
For the authorization rule we support 2 models, a basic list of agent.action rules or a more full featured Open Policy Agent based flow. Here’s the content of a JWT token using the Agent List authorization rules:
{
   "agents": [
    "rpcutil.ping",
    "puppet.*"
   ],
   "callerid": "okta=rip@choria.io",
   "exp": 1547742762,
   "nbf": 1547634762,
   "iat": 1547634762,
   "ou": "choria",
   "permissions": {
      "streams_admin": true,
      "events_viewer": true
   },
   "public_key": "50485e558877b53f2e9cc479e417b7e9ad280729742842726fd1c7f3edf9a517"
}
Here I am allowed to access all actions on the puppet agent and only 1 action on the rpcutil agent. The token encodes who I am (callerid and public_key) and how long the token is valid for. It also gives me some broker level permissions for Choria Streams. The token is signed using an RSA private key.
More complex policies can be written using Open Policy Agent and embedded in the token, here’s an example policy:
# must be in this package
package io.choria.aaasvc

# it only checks `allow`, its good to default false
default allow = false

# user can deploy only frontend of myco into production but only in malta
allow {
	input.action == "deploy"
	input.agent == "myco"
	input.data.component == "frontend"
	requires_fact_filter("country=mt")
	input.collective == "production"
}

# can ask status anywhere in any environment
allow {
	input.action == "status"
	input.agent == "myco"
}

# user can do anything myco related in development
allow {
	input.agent == "myco"
	input.collective == "development"
}
This policy is written into the JWT, signed by the key and cannot be modified by the user.
Authorization and Auditing
Running in every Overlay is a Signing Service. The signing service holds a private key that is trusted by the Choria network to delegate identity. That is the key signer.privileged can state to the Choria protocol that the caller identity is in fact okta=rip@choria.io instead of that of the privileged key.
When a client holding a JWT token wish to communicate with Choria they send their JWT token and request to the signer. The signer evaluates the policy embedded in the JWT token, checks that the token is valid - including verifying the signature and expiry times - and if all is allowed and correct it signs the request giving it back to the caller.
From there the caller continues as normal publishing the message and processing replies.
The individual fleet nodes will then see a request coming in from okta=rip@choria.io, they will perform their own AAA based on that identity.
Authorized and denied requests are audited by this central signing component, it supports writing individual audit log entries to files and Choria Streams where the Stream Replicator can pick up these audit logs and send them to the central infrastructure for long term archival. The audit logs are described in the io.choria.signer.v1.signature_audit schema.
Further Reading
- Choria AAA Service
- Centralized AAA
- Choria AAA Improvements
- Rego Policies for Choria Server
- Open Policy Agent in AAA Service
- New pkcs11 Security Provider
- Limiting Clients to IP Ranges
TODO
- Improvements for Choria Streams auditing
- Extending JWT tokens to declare which tenant in a multi tenant environment a token has access to
Node Metadata
Having an up to date inventory for a fleet is essential to successful orchestration, Choria has extensive per-rpc request discovery facilities that can help on the last mile, but when presenting users with user-interfaces, where subsets of fleets can be selected for workflows, this information has to be accurate and current.
Building large fleet metadata services is a significant undertaking, Choria plays a role in this, but, it’s generally only 1 input into a larger effort to consolidate information from many enterprise sources.
The general flow of metadata from node to central is:
- Choria Server regularly publish Lifecycle Events in CloudEvent format.
- Choria can read files as inventory input - tags and facts.
- Inventory files can be made using Cron or Autonomous Agents
- Inventory data can be regularly published, typically every 5 minutes
- Choria Data Adapters receive, validate, unpack and restructure inventory data into Choria Streams
- Choria Stream Replicator intelligently moves the data to other regions
- Custom internal processors read the streams as input into building local databases
Optionally the metadata databases can be integrated into Choria Discovery for use via CLI or RPC API.
This data flow is discussed extensively on a talk I gave at Configuration Management Camp titled Solving large scale operational metadata problems using stream processing.
Node Metadata Capture
On a basic level gathering node data might be as simple as running facter -y everywhere, in a more dynamic environment you might have multiple ways to gather data on a specific machine and configuring Cron might not really be an option.
We therefore prefer to create an Autonomous Agent that embeds all the dependencies, scripts and so forth to gather the metadata for a node, and we run that using a Schedule Watcher.
One can have an autonomous agent whose function is to manage other autonomous agents, downloading metadata gathering agents from systems like Artifactory. Perhaps based on Key-Value data stored in Choria Key-Value Store. Choria includes, but do not enable, Autonomous agent watchers that can do this: Archive Watcher and Machines Watcher.
The 2 watchers above combine to read a - ed25519 private key signed - specification of autonomous agents to deploy to the fleet, below is an example before signing. This data is read from Choria Key-Value Store and concurrency is controlled using Choria Governors.
[
 {
   "name": "facts",
     "source": "https://example.net/metadata/metadata-machine-1.0.0.tgz",
     "verify": "SHA256SUMS",
     "verify_checksum": "1e85719c6959eb0f2c8f2166e30ae952ccaef2c286f31868ea1d311d3738a339",
     "checksum": "f11ea2005de97bf309bafac46e77c01925307a26675f44f388d4502d2b9d00bf",
     "match": "has_command('facter')"
 }
]
Using this method several Autonomous agents can be safely deployed and actively managed. If any changes are made to the agents they will be re-deployed from scratch protecting the integrity of the system end to end.
Publishing Metadata
Once the data is stored in a file Choria Server can be configured to publish this regularly using 3 configuration options:
plugin.choria.registration.inventory_content.compression = true
plugin.choria.registration.inventory_content.target = mcollective.ingest.discovery.n1.example.net
registerinterval = 300
This will result in compressed data being published to the choria.ingest.discovery.n1.example.net subject every 5 minutes. The data is in the format choria:registration:inventorycontent:1
Publishing this data is lossy, we do not retry, we do not wait for acknowledgement of it being processed, it’s simply a regular ping of data.
This is combined with regular Lifecycle events - starting, stopping, still alive etc.
Moving data to Choria Streams
Choria Adapters receive this data and feeds it into Choria Streams, this is configured on the broker:
plugin.choria.adapters = jetstream
plugin.choria.adapter.jetstream.type = jetstream
plugin.choria.adapter.jetstream.stream.servers = broker-broker-ss:4222
plugin.choria.adapter.jetstream.stream.topic = js.in.discovery.%s
plugin.choria.adapter.jetstream.ingest.topic = mcollective.ingest.discovery.>
plugin.choria.adapter.jetstream.ingest.protocol = request
Here we subscribe to data on mcollective.ingest.discovery.> and we publish it to js.in.discovery.%s, where %s will be replaced by the node name giving you the flexibility to keep, for example, 5 most recently metadata publishes per node with the oldest one being 7 days old.
The data is placed in Choria Streams in the format choria:adapters:jetstream:output:1
Replicating Data
The Choria Stream Replicator copies data between 2 streams, it has features that makes it particularly suitable for replicating node metadata produced by Choria.
- It tracks Lifecycle events to know about new machines, cleanly shutdown machines, crashed machines (absence of data) and can publish / replicate advisories about fleet health
- It can sample data from a source stream intelligently ensuring that new nodes get replicated immediately and for healthy nodes only replicated hourly
Using these advisory events central systems or even regional orchestration systems will be aware immediately when a new node is up that it is up anywhere in the fleet and will soon get a fresh set of metadata for that node. This is done using age advisories that other systems can listen for. This way when a central workflow engine presents a list of orchestration targets they can visually warn that machines being targeted have not been seen for a short while - often with higher fidelity than enterprise monitoring systems.
The sampling pattern means in our Overlay we can have 5 minutely data but moving that date out of our Overlay can happen only once per hour for any node (but immediately if it’s new). This way we do not affect a denial of service against central infrastructure.
While Stream Replicator has special modes to handle node metadata, it can replicate any stream data and has various modes for order-preserving strictness or very fast parallel replication etc. Thus we use the same technology to shift workflow status updates, new jobs, life cycle events and monitoring data around the infrastructure.
Consuming Data
Ultimately Choria is only concerned with shifting data here or managing user supplied plugins for gathering data. The data can be consumed in Go, Java, .Net or any of the 40+ languages that has support for NATS. The data can be consumed, combined and saved into databases like MongoDB, processed live or feed into other systems for other teams and business units by way of replication.
Further Reading
- Choria Lifecycle Events
- Transitioning Events to CloudEvents
- Solving large scale operational metadata problems using stream processing
TODO
- Support Choria Streams / JetStream in Stream Replicator
- Allow HA groups of Stream Replicators
Job Status Updates and other Events
Focusing on the workflow problem space again, some background about how a node executes a job will be needed. Essentially we have a job / workflow description language that describes one or multiple steps to complete.
This is handed to the node via a RPC call, the node spawns a background job process that handles the life of that job or sub-job, executing each step until completion.
As the job runs the node might want to communicate details about individual steps, or the job. Step started, Step running, Step logs, Stop completed, next Step started and so forth.
As these are external processes that runs and exit when done, they cannot really have their own connection to the Choria Broker - it would massively increase the specifications needed by the central infrastructure. Further, as the job execution is short lived, it cannot be expected to retry deliveries to the broker during network events.
Choria can be configured to accept such messages from cron job, agents, really any external process running on the node using the Message Submit feature.
Shell scripts can essentially stick some payload in a temporary file and run choria tool submit --config /etc/choria/server.conf --reliable --sender myapp.production myapp.metrics /tmp/payload, which will result in a reliable message being submitted to Choria, it will on behalf of the Cron job retry this message until completion. There is also a Go API for submitting messages in this manner.
The system support priority queues, maximum delivery attempts, unreliable messages for regularly published metrics, can maintain order between reliable messages and more. They are kept in a spool on each node, great care is taken to not fill the node up or cause problems on disk - we’ll rather reject messages than try our best - at the expense of the node - to accept each one.
These messages are published over the Choria Broker, optionally into Streams, and can be consumed by any of 40 different programming languages. Those stored in streams can be replicated elsewhere using Choria Stream Replicator as detailed above.
Job execution APIs
One of the oldest, if not THE oldest, features in Choria via its Marionette Collective roots is the ability to host agents. An agent is essentially a collection of related APIs. For example the service agent have separate functions, called actions, to start, stop, obtain status, enable or disable a service on any supported operating system.
These agents have schemas (we call them DDLs) that describes the inputs, outputs, actions, validations and even how to summarise the data you receive from them.
These agents can be accessed from CLI, Ruby Scripts, Puppet DSL based Playbooks or Go based programs. All access is subject to validation and control of the DDL files.
Agents can be written in Ruby, Go compiled into the Server, Go via an external helper, Python via an external helper or really in any language you want by implementing the quite easy external extension interface.
In the context of our Job system we have an Agent that has amongst others these actions:
run_workflow- given a YAML workflow spawns a seperate manager process that runs the workflow to completely, disconnected from Choria, returns execution IDs and workflow IDquery_workflow- given a execution ID or workflow ID obtain a overall job status for that IDstop_workflow- stops a currently running workflow by its execution or workflow IDrunning_workflows- retrieves a list of all currently running workflows on this node
Essentially the agent has a on-node spool directory where it writes statuses, job definitions and more. Each running job has a light-weight Go process that manages the life cycle of that job execution.
In spirit this is very similar to how Puppet Tasks is integrated into Choria. A background execution engine maintains a spool per job and writes statuses there.
When this is combined with the Message Submit feature long-running executions can communicate their statuses back to the Overlay coordinator via Choria Streams.
Once an agent is developed and deployed high performance Go clients can be generated allowing programmatic access to these agents allowing robust RPC execution:
- Can access 50 000 nodes in 2 seconds
- Support various networking models common to node orchestration - batches, canary, random set selection, retries and more
- Integrates with all the Choria Security and Discovery features.
Fully exploring this is out of scope for this document, but we have it documented in the Extending Choria section of the documentation.
Asynchronous RPC
When building backend systems capable of processing many concurrent RPC requests and that support independent state queries of potentially long-running RPC requests we need to move from our typical synchronous RPC request model to an asynchronous model.
This allows our Job Infrastructure to adopt a microservices design where multiple services can get access to request status, progress, outcomes etc independently without being in-process with the client as a synchronous client would require.
The general Choria RPC flow is as follows, the entire request is modeled as a single blocking call multiplexed over multiple connections to the Broker. Discovery can be any of the discovery methods, files, network, API calls to databases whatever is configured in Choria.
Generally this is fine for interactive user or even in background automations, but on a busy system trying to coordinate 10s or 100s of concurrent workflows this becomes onerous as one might need many threads and many connections.
Choria supports splitting this process at the loop marked Replies where the Client receives and handle replies from the fleet.
We have a long-running process (4) that listens constantly on the network for replies. It receives any reply and stores it in the storage (5), this can be something like MongoDB. The Client (1) queries this storage for replies related to a request it made. If the client creates a record for every RPC request and associate the replies we have a flow that works really well for web based systems.
In this model the Client (1) do not need a reply channel, do not need to wait for any replies or block past the small period where requests are published. The receiver process (4) can be scaled horizontally for reliability and scalability. Accessing request results, progress, outcomes etc is now standard database operations. Showing result progress is a consolidation against discovered nodes and replied nodes.
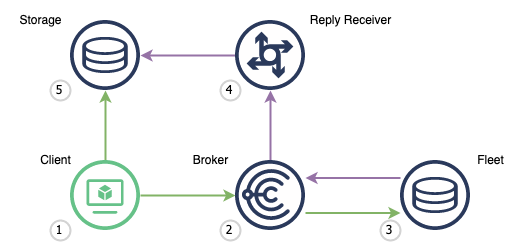
A flow sequence of a complete setup can be seen below:
A simplified Request Publisher can be seen here that essentially does choria req rpcutil ping but with a custom reply
set via the environment variable REPLY, we do not perform the steps to store the data in a database but that is fairly easy:
package main

import (
	"context"
	"fmt"
	"os"

	"github.com/choria-io/go-choria/client/rpcutilclient"
)

func main() {
	rpcu,err:=rpcutilclient.New()
	panicIfErr(err)

	res,err:=rpcu.OptionReplyTo(os.Getenv("REPLY")).Ping().Do(context.Background())
	panicIfErr(err)

	fmt.Println(res.Stats().UniqueRequestID())
}
We can set up a dedicated receiver for these Replies, here we just validate and parse them, you would process them based on the values
of reply.Agent() and r.Action into the correct structures and process them as needed, here we just log them.
Here we read the messages live from the network with no buffering though one can imagine a scenario where messages are sent into Choria Streams, by setting a stream as reply, and then using a Stream Consumer to loop over the received messages to create a reliable/buffered channel:
package main

import (
   "context"
   "crypto/md5"
   "fmt"
   "os"
   "strings"

   "github.com/choria-io/go-choria/choria"
   "github.com/choria-io/go-choria/providers/agent/mcorpc/client"
)

func main() {
   fw, err := choria.New(choria.UserConfig())
   panicIfErr(err)

   log := fw.Logger("receiver")

   conn, err := fw.NewConnector(context.Background(), fw.MiddlewareServers, "async-receiver", fw.Logger("conn"))
   panicIfErr(err)

   msgs, err := conn.ChanQueueSubscribe(fmt.Sprintf("async-reciver-%d", os.Getpid()), os.Getenv("REPLY"), "async", 1000)
   panicIfErr(err)

   for msg := range msgs {
      reply, err := fw.NewReplyFromTransportJSON(msg.Data, true)
      if err != nil {
         log.Errorf("Could not handle reply: %s", err)
         continue
      }

      r, err := client.ParseReply(reply)
      if err != nil {
         log.Errorf("Could not handle reply: %s", err)
         continue
      }

      log.Infof("[%s] Received a reply from %s via %s#%s request %s: %s", reply.Time(), reply.SenderID(), reply.Agent(), r.Action, reply.RequestID(), r.Statusmsg)
      log.Infof(">>> %s", r.Data)
   }
}
Output from this looks like:
INFO[0004] [2021-08-02 15:07:06 +0200 CEST] Received a reply from example.net via rpcutil#ping request 96dbb3da5c9e45bb96a1211b81764cb1: OK  component=receiver
INFO[0004] >>> {"pong":1627909626}                       component=receiver